Buy Sell Volume with delta value📄 Script Description
This indicator decomposes total traded volume into buying and selling volume, and displays their relative ratios.
🔎 Key Features
Buying vs. Selling Volume Separation
Uses the candle’s high, low, and close to split total volume into buying volume and selling volume.
Formula:
Buy = volume * (close - low) / (high - low)
Sell = volume * (high - close) / (high - low)
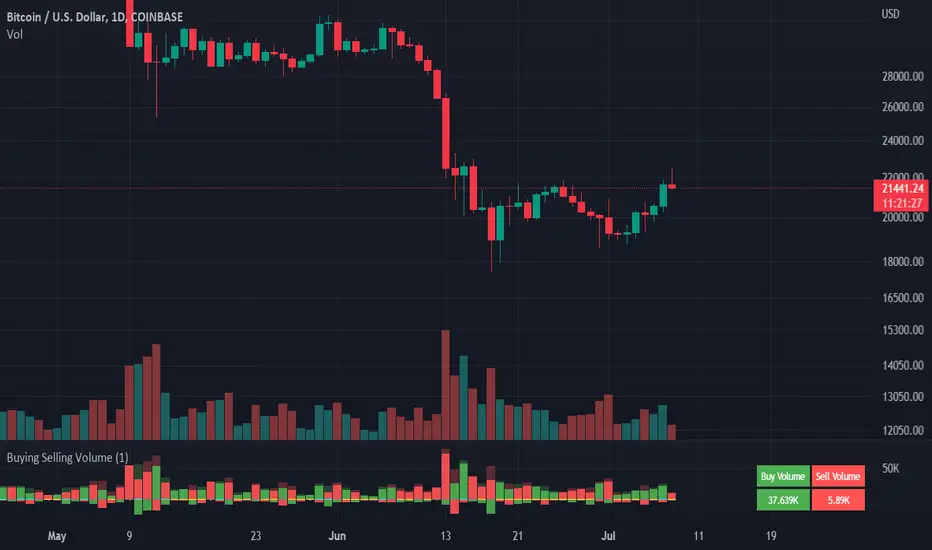
Volume Histogram Visualization
Plots overall volume (upper/lower) and separated buy/sell volumes as color-coded columns.
UPPER V / LOWER V: total volume
BUY V: buying volume (teal)
SELL V: selling volume (red)
Buy/Sell Ratio Calculation
Computes the percentage of buy and sell volume relative to total volume.
Buy Ratio = buyVolume / totalVolume * 100
Sell Ratio = sellVolume / totalVolume * 100
Ratio Display
Shows the latest Buy Ratio in a table (top-right corner of the chart).
Adds a label above the most recent bar displaying:
"Buy XX% / Sell YY%"
Historical ratios can be inspected through the TradingView Data Window or tooltip.
🛠️ Usage
Quickly identify whether volume during each candle is dominated by buyers or sellers.
Helps to assess market pressure and confirm potential trend direction, entries, or exits.
⚠️ Notes
Labels are shown only on the most recent bar (Pine cannot track mouse cursor events).
To see historical values, use the TradingView Data Window or hover tooltips.
This method provides an approximate split of volume and does not perfectly capture all market order flows.
Cerca negli script per "Buy sell"

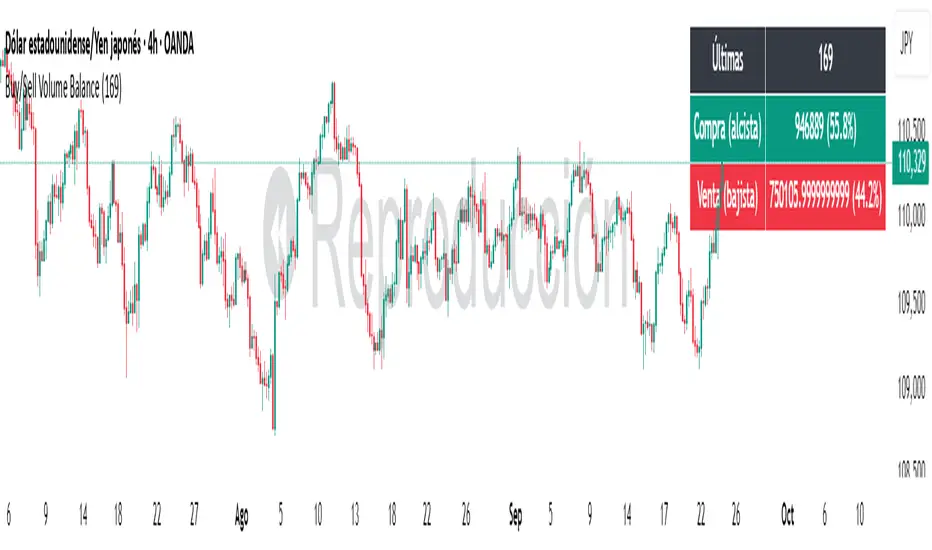
Buy/Sell Volume BalanceDESCRIPTION
Buy/Sell Volume Balance is a simple yet powerful indicator designed to measure and visualize the balance between buying and selling volume over a customizable number of recent candles. It helps traders quickly assess market pressure during consolidation phases or ranges, in order to anticipate the most likely breakout direction.
How it works
The indicator analyzes the last N candles (default = 100, user-editable).
Each candle’s total volume is classified as:
Bullish volume (Buy volume): if the candle closes above or equal to its open.
Bearish volume (Sell volume): if the candle closes below its open.
The volumes are summed separately to calculate:
Total Buy Volume
Total Sell Volume
The percentage of each side relative to the total is also displayed.
All results are shown in a fixed table at the top of the chart for quick interpretation.
Purpose
This tool is specifically designed to help traders evaluate the internal battle between buyers and sellers during a range or sideways market. By understanding which side is accumulating more volume within the range, traders can anticipate which direction is more likely when the price breaks out.
If Buy volume dominates → potential bullish breakout.
If Sell volume dominates → potential bearish breakout.
If both sides are nearly balanced, it signals indecision and a higher chance of false breakouts.
Imbalance Threshold
In practice, traders often consider a clear imbalance when one side reaches at least 55–60% of the total volume.
Above this threshold, the dominant side is more likely to dictate the breakout direction.
Below this threshold, the market is usually in indecision and further confirmation is needed before acting.
How to use it
Add the indicator to your chart and choose the lookback period (number of candles).
Focus on ranges or consolidation zones where price is moving sideways.
Observe the balance of Buy vs Sell volume in the top-right box:
A clear imbalance (>55–60%) suggests the stronger side is more likely to push the breakout.
A balanced ratio (<55–60%) indicates indecision and possible false breakouts.
Use it in combination with support/resistance zones, breakout patterns, or volume spikes for best results.
✅ In summary: This indicator does not give direct buy/sell signals, but it provides valuable context about market pressure, helping you to align your trades with the most probable breakout direction.
buy sell ultra systemWhat it is
EMA-POC Momentum System Ultra combines a proven trend stack (EMA 20/50/238), a price-of-control layer (POC via Bar-POC or VWAP alternative), and a momentum trigger (RSI) to surface higher-quality entries only when multiple, independent conditions align. This is not a cosmetic mashup; each component gates the others.
How components work together
Trend (EMA 20/50/238): Defines short/medium/long bias and filters counter-trend signals.
POC (Bar-POC or Alt-POC/VWAP): Locates the most-traded/weighted price area; a neutral band around POC helps avoid chop.
Control background: Above POC → buyers likely in control; below → sellers.
Momentum (RSI): Entry arrows print only when RSI confirms with trend and price location vs POC; optional “cross 50” requirement reduces noise.
Optional HTF trend: Confluence with a higher-timeframe EMA stack for stricter filtering.
Why it’s original/useful
Signals require confluence of (1) EMA trend stack, (2) POC location and neutral-zone filtering, (3) momentum confirmation, (4) optional slope and distance-to-POC checks, and (5) optional HTF trend. This reduces false positives compared with using any layer in isolation.
How to use
Markets/TFs: Built for XAUUSD (Gold) and US30. Works 1m–1h for intraday; 2h–4h for swing.
Entries:
Long: EMA stack bullish, price above POC, not in neutral band, RSI condition true → “Buy” arrow.
Short: Opposite conditions → “Sell” arrow.
Stops/Targets (suggested):
Initial stop beyond POC/neutral band or recent swing.
First target around 1R; trail with EMA20/50 or structure breaks.
Settings to tune:
POC Mode: Bar-POC (highest-volume bar’s close over lookback) or Alt-POC (VWAP).
Neutral Band %: 0.10–0.35 typical intraday.
Min distance from POC: 0.10–0.50% helps avoid low-RR entries right at POC.
RSI: Choose “cross 50” for stricter triggers or simple >/< 50 for more signals.
HTF trend: Turn on for extra confluence.
Alerts:
Buy Signal and Sell Signal (separate), or one Combined Buy/Sell alert.
Set to “Once per bar close” if you want only confirmed arrows.
Repainting / limitations
Shapes can move until bar close (standard Pine behavior) when using intrabar conditions; final confirmation at close. No system guarantees profitability—forward test and adapt to your market/instrument.
Clean chart
The published chart contains only this script so outputs are easy to identify.
Versions / updates
Use Publish → Update for minor changes; do not create new publications for small tweaks. If you fork to preserve older behavior, explain why and how your fork differs.
Changelog
v1.1 – Tuning for Gold/US30, neutral-band & distance filters, optional HTF trend, combined alert.
v1.0 – Initial public release (EMA stack + POC modes + RSI + alerts).
License & credits
Open-source for learning and improvement. Please credit on forks and explain modifications in your description.

Buying Selling Volume v3Bug fixed from v2. Currently adds up values correctly.
Note: To get more accurate readings reduce the time frame. For some reason it isn't counting the last bar and I am not smart enough to figure out why.
Builds on Ceyhun's "Buying Selling Volume" indicator. This version allows users to define periods by effortlessly dragging two points or you may define periods by manually entering the start and end times in the settings window. Once the period is defined, both buying and selling volume will be totaled thus displaying the amount of buys and sells in that period.
I have found the information provided from the script helps in defining a period of consolidation as either being accumulative or distributive.
Buying Selling Volume v2Builds on Ceyhun's "Buying Selling Volume" indicator. This version allows users to define periods by effortlessly dragging two points or you may define periods by manually entering the start and end times in the settings window. Once the period is defined, both buying and selling volume will be totaled thus displaying the amount of buys and sells in that period.
I have found the information provided from the script helps in defining a period of consolidation as either being accumulative or distributive.

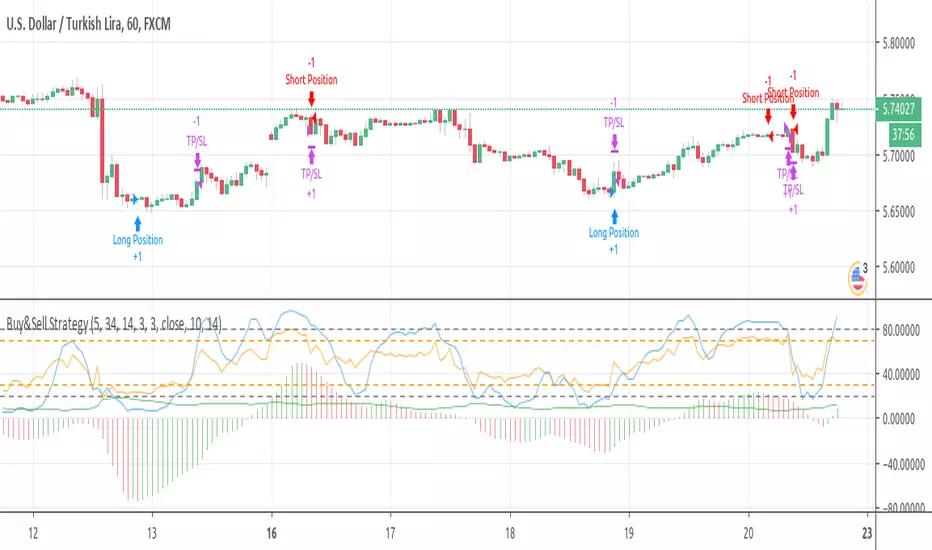
Buy&Sell Strategy depends on AO+Stoch+RSI+ATR by SerdarYILMAZThis strategy is just for training, its purpose is just learning code in pine script.
Don't make buy or sell decision with this strategy.
Turkish/Turkce
Bu strateji sadece pine script'te kodlamanın nasıl yapildigini ogrenmek icindir.
Bu stratejiye dayanarak, kesinlikle al-sat islemleri yapmayin.
How it works?
When RSI and Stoch are in oversold area and if awesome osc. turns positive, take long position. Stop loss and take profit levels were defined with ATR ind.
When RSI and Stoch are in overbought are and if awesome osc. turns negative, take short position. Stop loss and take profit levels were defined with ATR ind.
Turkish/Turkce
RSI ve Stoch asiri satım bölgesinde iken awesome pozitife döner ise long pozisyon açar, zarar kes ve kar al seviyeleri ATR indikatoru ile tanımlandı.
RSI ve Stoch asırı alım bölgesinde iken awesome negatife döner ise short pozisyon açar, zarar kes ve kar al seviyeleri ATR indikatoru ile tanımlandı.
Buy/Sell Demand Pressure SMAThis indicator shows when competing buying and selling pressure has changed.
When bullish buying offsets bearish transaction volume, the indicator turns green. When bearish selling pressure offsets bullish buying volume the indicator is red.
Can be used as a normal SMA or to confirm buy/sell signals of other indicators.
Works best at the start of trades...and not exits but if set properly, it is a good indicator of when a trend has reversed.
~ jb tuttle

Buy/Sell Signals (MACD + RSI) 1HThis is a Pine Script indicator for TradingView that plots Buy/Sell signals based on the combination of MACD and RSI indicators on a 1-hour chart.
Description of the Code:
Indicator Setup:
The script is set to overlay the Buy/Sell signals directly on the price chart (using overlay=true).
The indicator is named "Buy/Sell Signals (MACD + RSI) 1H".
MACD Settings:
The MACD (Moving Average Convergence Divergence) uses standard settings of:
Fast Length: 12
Slow Length: 26
Signal Line Smoothing: 9
The MACD line and the Signal line are calculated using the ta.macd() function.
RSI Settings:
The RSI (Relative Strength Index) is calculated with a 14-period setting using the ta.rsi() function.
Buy/Sell Conditions:
Buy Signal:
Triggered when the MACD line crosses above the Signal line (Golden Cross).
RSI value is below 50.
Sell Signal:
Triggered when the MACD line crosses below the Signal line (Dead Cross).
RSI value is above 50.
Signal Visualization:
Buy Signals:
Green "BUY" labels are plotted below the price bars where the Buy conditions are met.
Sell Signals:
Red "SELL" labels are plotted above the price bars where the Sell conditions are met.
Chart Timeframe:
While the code itself doesn't enforce a specific timeframe, the name indicates that this indicator is intended to be used on a 1-hour chart.
To use it effectively, apply the script on a 1-hour chart in TradingView.
How It Works:
This indicator combines MACD and RSI to generate Buy/Sell signals:
The MACD identifies potential trend changes or momentum shifts (via crossovers).
The RSI ensures that Buy/Sell signals align with broader momentum (e.g., Buy when RSI < 50 to avoid overbought conditions).
When the defined conditions for Buy or Sell are met, visual signals (labels) are plotted on the chart.
How to Use:
Copy the code into the Pine Script editor in TradingView.
Save and apply the script to your 1-hour chart.
Look for:
"BUY" signals (green): Indicating potential upward trends or buying opportunities.
"SELL" signals (red): Indicating potential downward trends or selling opportunities.
This script is simple and focuses purely on providing actionable Buy/Sell signals based on two powerful indicators, making it ideal for traders who prefer a clean chart without clutter. Let me know if you need further customization!

Buy-Sell Volume Bar Gauge [By MUQWISHI]▋ INTRODUCTION :
The Buy-Sell Volume Bar Gauge is developed to provide traders with a detailed analysis of volume in bars using a low timeframe, such as a 1-second interval, to measure the dominance of buy and sell for each bar. By highlighting the balance between buying and selling activities, the Buy-Sell Volume Bar Gauge helps traders identify potential volume momentum of a bar; aimed at being a useful tool for day traders and scalpers.
_______________________
▋ OVERVIEW:
_______________________
▋ METHODOLOGY:
The concept is based on bars from a lower timeframe within the current chart timeframe bar, where volume is categorized into Up, Down, and Neutral Volume, with each one displayed as a portion of a column plot. Up Volume is recorded when the price experiences a positive change, Down Volume occurs when the price experiences a negative change, and Neutral Volume is observed when the price shows no significant change.
_______________________
▋ INDICATOR SETTINGS:
(1) Fetch data from the selected lower timeframe. Note: If the selected timeframe is invalid (higher than chart), the indicator will automatically switch to 1 second.
(2) Price Source.
(3) Treating Neutral Data (Price Source) as
Neutral: In a lower timeframe, when the bar has no change in its price, the volume is counted as Neutral Volume.
Previous Move: In a lower timeframe, when the bar has no change in its price, the volume is counted as the previous change; “Up Volume” if the previous change was positive, and “Down Volume” if the previous change was negative.
Opposite Previous Move: In a lower timeframe, when the bar has no change in its price, the volume is counted as the opposite previous change; “Up Volume” if the previous change was negative, and “Down Volume” if the previous change was positive.
(4) Average Volume Length, it's used for lighting/darkening columns in a plot.
(5) Enable Alert.
(7) Total bought (%) Level.
(8) Total Sold (%) Level.
_____________________
▋ COMMENT:
The Buy-Sell Volume Bar Gauge can be taken as confirmation for predicting the next move, but it should not be considered a major factor in making a trading decision.

Buying - Selling StrengthThis script is designed as a TradingView indicator called "Buying Selling Volume". It aims to provide insights into buying and selling pressures in the market, along with the comparison of these pressures against moving averages.
Calculation of Buying and Selling Volumes:
Buying Volume (BV) is calculated based on the difference between the close price and the low price, weighted by the volume traded.
Selling Volume (SV) is calculated based on the difference between the high price and the close price, weighted by the volume traded.
These volumes are normalized to ensure positive values.
Plotting of Buying and Selling Volumes:
The script plots the Buying Volume (green) and Selling Volume (red) on the chart using vertical bars.
Each bar represents the relative strength of buying or selling pressure at a given point in time.
Moving Averages Calculation:
Users can select the type of moving average (SMA, EMA, WMA, or VWMA) and the length of each moving average.
Moving averages are calculated for both buying and selling volumes based on the selected parameters.
Plotting of Moving Averages:
The script plots the selected moving averages for buying (blue) and selling (orange) volumes on the chart.
These moving averages provide smoothed representations of the underlying volume trends.
Bar Color and Background Color:
The script dynamically adjusts the color of the bars and the background based on specific conditions:
If both buying and selling volumes are above their respective moving averages, the bar color is green, indicating a bullish signal.
If both volumes are below their moving averages, the bar color is red, indicating a bearish signal.
If buying volume is above its moving average while selling volume is below its moving average, the bar color is yellow, suggesting mixed market sentiment.
Otherwise, the bar color is gray, indicating a neutral market condition.

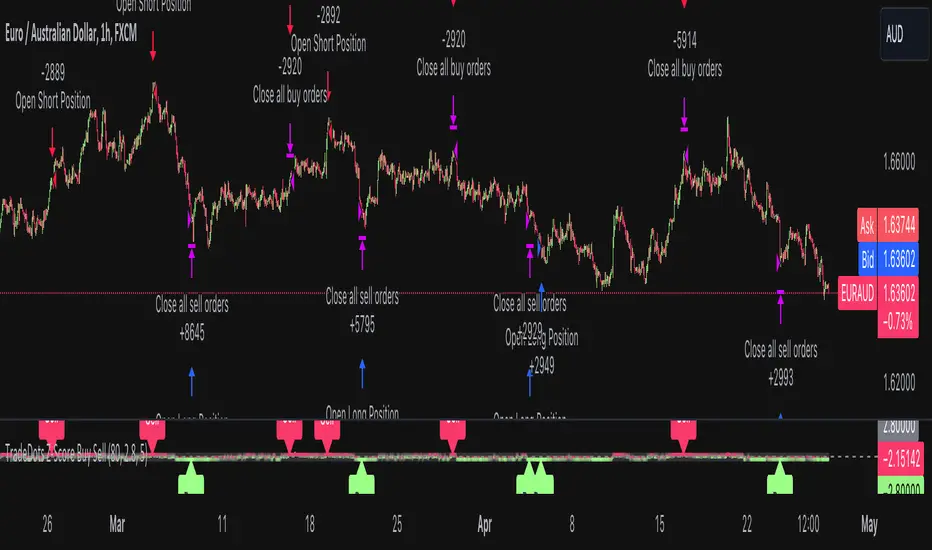
Buy Sell Strategy With Z-Score [TradeDots]The "Buy Sell Strategy With Z-Score" is a trading strategy that harnesses Z-Score statistical metrics to identify potential pricing reversals, for opportunistic buying and selling opportunities.
HOW DOES IT WORK
The strategy operates by calculating the Z-Score of the closing price for each candlestick. This allows us to evaluate how significantly the current price deviates from its typical volatility level.
The strategy first takes the scope of a rolling window, adjusted to the user's preference. This window is used to compute both the standard deviation and mean value. With these values, the strategic model finalizes the Z-Score. This determination is accomplished by subtracting the mean from the closing price and dividing the resulting value by the standard deviation.
This approach provides an estimation of the price's departure from its traditional trajectory, thereby identifying market conditions conducive to an asset being overpriced or underpriced.
APPLICATION
Firstly, it is better to identify a stable trading pair for this technique, such as two stocks with considerable correlation. This is to ensure conformance with the statistical model's assumption of a normal Gaussian distribution model. The ideal performance is theoretically situated within a sideways market devoid of skewness.
Following pair selection, the user should refine the span of the rolling window. A broader window smoothens the mean, more accurately capturing long-term market trends, while potentially enhancing volatility. This refinement results in fewer, yet precise trading signals.
Finally, the user must settle on an optimal Z-Score threshold, which essentially dictates the timing for buy/sell actions when the Z-Score exceeds with thresholds. A positive threshold signifies the price veering away from its mean, triggering a sell signal. Conversely, a negative threshold denotes the price falling below its mean, illustrating an underpriced condition that prompts a buy signal.
Within a normal distribution, a Z-Score of 1 records about 68% of occurrences centered at the mean, while a Z-Score of 2 captures approximately 95% of occurrences.
The 'cool down period' is essentially the number of bars that await before the next signal generation. This feature is employed to dodge the occurrence of multiple signals in a short period.
DEFAULT SETUP
The following is the default setup on EURUSD 1h timeframe
Rolling Window: 80
Z-Score Threshold: 2.8
Signal Cool Down Period: 5
Commission: 0.03%
Initial Capital: $10,000
Equity per Trade: 30%
RISK DISCLAIMER
Trading entails substantial risk, and most day traders incur losses. All content, tools, scripts, articles, and education provided by TradeDots serve purely informational and educational purposes. Past performances are not definitive predictors of future results.
Buy/Sell Signal Template/Boilerplate Strategy [MyTradingCoder]This script allows the user to connect an external indicator output/plot value to allow for a no-code solution to setup a simple buy/sell signal strategy. For those of you who do not know how to program, do not be intimidated as this is a very easy setup process.
Maybe you want to buy when the 'RSI' value drops below '30' and then sell when the 'RSI' value climbs above '70', but you don't want to code it. You can do that with this indicator along with thousands of others found on the free TradingView indicator library.
Step #1:
Put the strategy on the chart.
Step #2:
Apply a secondary indicator onto the chart, such as an RSI .
Step #3:
Open the strategy settings and change the source to the RSI
Step #4:
Change the 'Signal Settings' to match when you want a buy, or a sell. For example, if you want to get a buy signal when the RSI crosses above 50, and get a sell when it crosses below 50, set the 'buy value' to 50, and the 'buy type' to greater than, then set the 'sell value' to 50 and the 'sell type' to less than. BOOM! It works :)

Buy/Sell Signal Template/Boilerplate [MyTradingCoder]This script allows the user to connect an external indicator output/plot value to allow for a no-code solution to setup a simple buy/sell signal indicator. For those of you who do not know how to program, do not be intimidated as this is a very easy setup process.
Maybe you want to buy when the 'RSI' value drops below '30' and then sell when the 'RSI' value climbs above '70', but you don't want to code it. You can do that with this indicator along with thousands of others found on the free TradingView indicator library.
Step #1:
Put the indicator on the chart.
Step #2:
Apply a secondary indicator onto the chart, such as an RSI.
Step #3:
Open the indicator settings and change the source to the RSI
Step #4:
Change the 'Signal Settings' to match when you want a buy, or a sell. For example, if you want to get a buy signal when the RSI crosses above 50, and get a sell when it crosses below 50, set the 'buy value' to 50, and the 'buy type' to greater than, then set the 'sell value' to 50 and the 'sell type' to less than. BOOM! It works :)

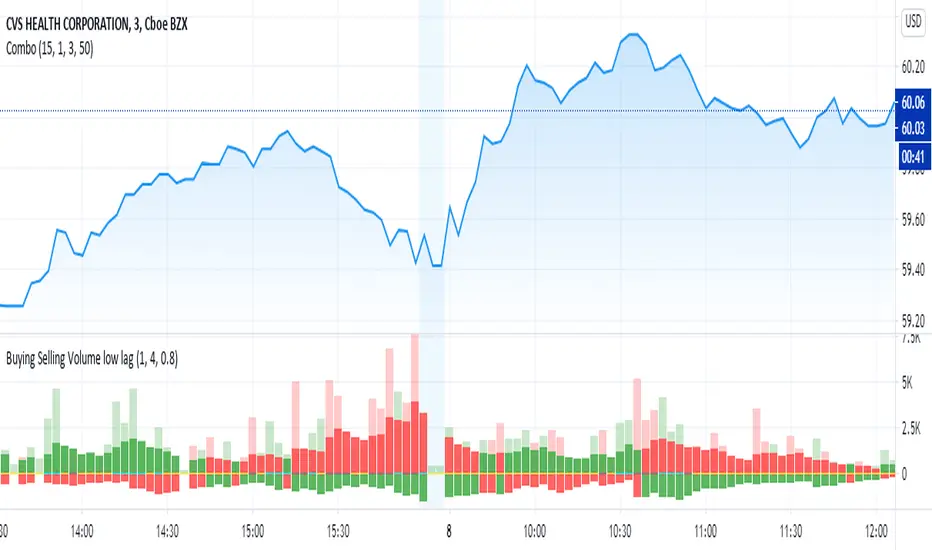
Buying Selling Volume low lagOriginally written by @ceyhun
I added a low lag filter to key components to smooth the bars. The user can adjust the parameters 'fast' and 'slow' to tune.
capam
The original comments of ceyhun are below repeated:
Buying Selling Volume
-Buy Volume
-Sell Volume
-Buy Volume Percent %
-Sell Volume Percent %
-Volume Index
-Buy Sell Volume-
BuyVolume>SellVolume=Blue barcolor
SellVolume>BuyVolume=Purple barcolor
-Volume Index-
VolumeIndex>length and close > open =Cyan barcolor
VolumeIndex>length and close < open =Gray barcolor
VolumeIndex<=length = Yellow barcolor
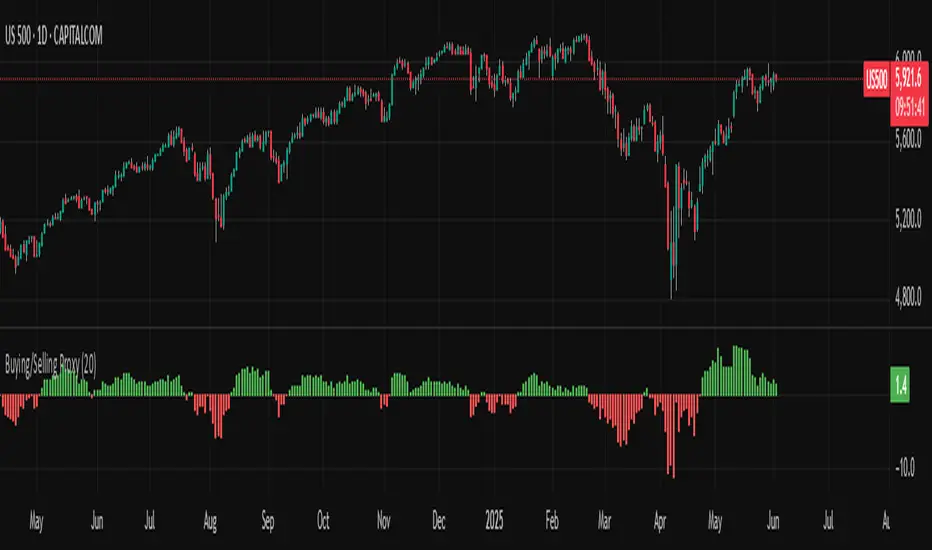
Buying/Selling ProxyTiltFolio Buying/Selling Proxy
This simple but effective indicator visualizes short-term buying or selling pressure using log returns over a rolling window.
How It Works:
Calculates the average of logarithmic returns over the past N bars (default: 20).
Positive values suggest sustained buying pressure; negative values indicate selling pressure.
Plotted as a color-coded histogram:
✅ Green = net buying
❌ Red = net selling
Why Use It:
This proxy helps traders gauge directional bias and momentum beneath the surface of price action — especially useful for confirming breakout strength, timing entries, or filtering signals.
- Inspired by academic return normalization, but optimized for practical use.
- Use alongside TiltFolio's Breakout Trend indicator for added context.
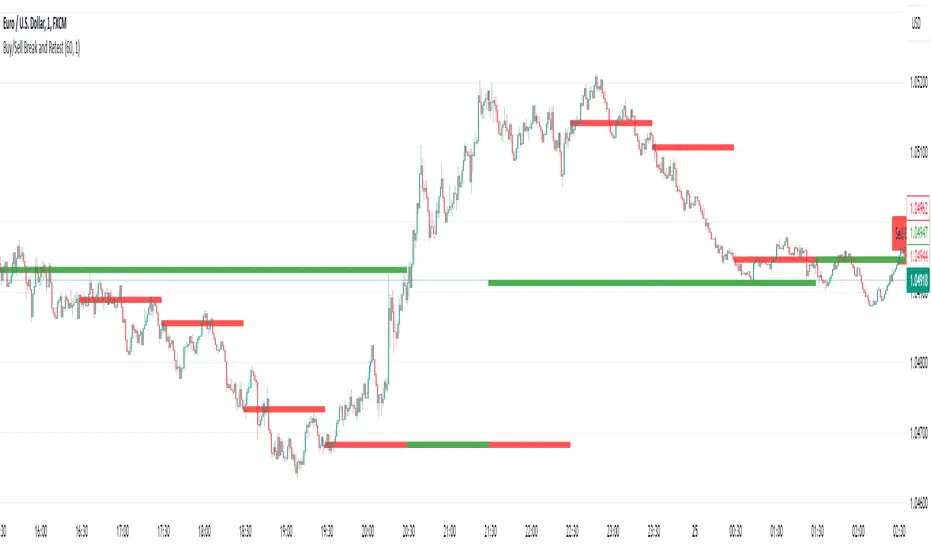
Buy/Sell Break and RetestThis script is a Pine Script indicator for TradingView titled **"Buy/Sell Break and Retest"**. Here's a description of its functionality:
### Purpose:
The script identifies potential **buy** and **sell entry levels** based on break-and-retest patterns in the market. It works by analyzing higher timeframe data (e.g., 1-hour) and marking entries on a lower timeframe (e.g., 1-minute).
### Key Features:
1. **Configurable Timeframes**:
- `Analysis Timeframe`: Used for identifying break-and-retest signals (default: 1-hour).
- `Entry Timeframe`: Used for marking and plotting entries (default: 1-minute).
2. **Buy and Sell Signals**:
- A **sell entry** is triggered when a bearish candle (close < open) is identified in the analysis timeframe.
- A **buy entry** is triggered when a bullish candle (close > open) is identified in the analysis timeframe.
3. **Retest Logic**:
- For sell signals: The retest is validated when the price breaks below the identified sell level.
- For buy signals: The retest is validated when the price breaks above the identified buy level.
4. **Visual Indicators**:
- Entry levels are marked with labels:
- **Buy Entry**: Green labels are placed at bullish candle opens.
- **Sell Entry**: Red labels are placed at bearish candle closes.
- Plots the levels for easy reference:
- **Sell Level**: Displayed as red circles on the chart.
- **Buy Level**: Displayed as green circles on the chart.
5. **Dynamic Updates**:
- Levels are cleared when invalidated by the price action.
### Use Case:
This indicator helps traders spot break-and-retest opportunities by:
- Allowing higher timeframe analysis to determine trend direction and key levels.
- Providing actionable buy and sell entry points on lower timeframes for precision.
Let me know if you'd like further clarification or improvements!
buy/sell signals with Support/Resistance (InvestYourAsset) 📣The present indicator is a MACD based buy/sell signals indicator with support and resistance, that can be used to identify potential buy and sell signals in a security's price.
📣It is based on the MACD (Moving Average Convergence Divergence) indicator, which is a momentum indicator that shows the relationship between two moving averages of a security's price.
📣 The indicator also plots support and resistance levels, which can be used to confirm buy and sell signals. The support and resistance can also be used as a stoploss for existing position.
👉 To use the indicator, simply add it to your trading chart. The indicator will plot three sections:
📈 Price and Signals: This section plots the security's price and the MACD buy and sell signals.
📈 MACD Oscillator: This section plots the MACD oscillator, which is a histogram that shows the difference between the two moving averages.
📈 Moving Averages: This section plots the two moving averages that the MACD oscillator is based on.
📈 Support and Resistance: This section plots support and resistance levels, which are calculated based on the security's recent price action.
👉 To identify buy and sell signals, you can look for the following:
📈 Buy signal: When shorter Moving Average crosses over longer Moving Average.
📈 Sell signal: When shorter moving average crosses under longer moving average.
📈 You can also look for divergences between the MACD oscillator and the security's price. A divergence occurs when the MACD oscillator is moving in one direction, but the security's price is moving in the opposite direction. Divergences can be a sign of a potential trend reversal.
👉 To confirm buy and sell signals, you can look for support and resistance levels take a look at below snapshot. If a buy signal occurs at a support level, it is a stronger signal than if it occurs at a random price level. Similarly, if a sell signal occurs at a resistance level, it is a stronger signal than if it occurs at a random price level.
⚡ Here is a example of how to use the indicator to identify buy signal:
☑ Add the indicator to your trading chart.
☑Look for a buy signal when short MA crosses over Long MA.
☑Look for the buy signal to occur at a support level.
☑Enter a long position at the next candle.
☑Place a stop loss order below the support level.
☑Take profit when the MACD line crosses below the signal line, or when the security reaches a resistance level.
⚡ Here is an example of how to use the indicator to identify a sell signal:
☑Add the indicator to your trading chart.
☑Look for a sell signal, when shorter moving average crosses under longer moving average.
☑Look for the sell signal to occur at a resistance level.
☑Enter a short position at the next candle.
☑Place a stop loss order above the resistance level.
☑Take profit when the MACD line crosses above the signal line, or when the security reaches a support level.
✅Things to consider while using the indicator:
📈Look for buy signals in an uptrend and sell signals in a downtrend. This will increase the likelihood of your trades being successful.
📈Place your stop losses below the previous swing low or support for buy signals and above the previous swing high or resistance for sell signals. This will help to limit your losses if the trade goes against you.
📈Consider taking profits at key resistance and support levels. This will help you to lock in your profits and avoid giving them back to the market.
Follow us for timely updates regarding indicators that we may publish in future and give it a like if you appreciate the indicator.

Buying/Selling Pressure Cycle (PreCy)No lag estimation of the buying/selling pressure for each candle.
----------------------------------------------------------------------------------------------------
WHY PreCY?
How much bearish pressure is there behind a group of bullish candles ?
Is this bearish pressure increasing?
When might it overcome the bullish pressure?
Those were my questions when I started this indicator. It lead me through the rabbit hole, where I discovered some secrets about the market. So I pushed deeper, and developped it a lot more, in order to understand what is really happening "behind the scene".
There are now 3 ways to read this indicator. It might look complicated at first, but the reward is to be able to anticipate and understand a lot more.
You can show/hide all the plots in the settings. So you can choose the way you prefer to use it.
----------------------------------------------------------------------------------------------------
FIRST WAY TO READ PreCy : The SIGNAL line
Go in the settings of PreCy, in "DISPLAY", uncheck "The pivot lines of the SIGNAL" and "The CYCLE areas". Make sure "The SIGNAL line" is checked.
The SIGNAL shows an estimation of the buying/selling pressure of each candle, going from 100 (100% bullish candle) to -100 (100% bearish candle). A doji would be shown close to zero.
Formula: Estimated % of buying pressure - Estimated % of selling pressure
It is a very choppy line in general, but its colors help make sense of it.
When this choppiness alternates between the extremes, then there is not much pressure on each candle, and it's very unpredictable.
When the pressure increases, the SIGNAL's amplitude changes. It "compresses", meaning there is some interest in the market. It can compress by alternating above and below zero, or it can stay above zero (bullish), or below zero (bearish) for a while.
When the SIGNAL becomes linear (in opposition to choppy), there is a lot of pressure, and it is directional. The participants agree for a move in a chosen direction.
The trajectory of the SIGNAL can help anticipate when a move is going to happen (directional increase of pressure), or stop (returning to zero) and possibly reverse (crossing zero).
Advanced uses:
The SIGNAL can make more sense on a specific timeframe, that would be aligned with the frequency of the orders at that moment. So it is a good idea to switch between timeframes until it gets less choppy, and more directional.
It is interesting to follow any regular progression of the SIGNAL, as it can reveal the intentions of the market makers to go in a certain direction discretely. There can be almost no volume and no move in the price action, yet the SIGNAL gets linear and moves away from one extreme, slowly crosses the zeroline, and pushes to the other extreme at the same time as the amplitude of the price action increases drastically.
----------------------------------------------------------------------------------------------------
SECOND WAY TO READ PreCy : The PIVOTS of the SIGNAL line
Go in the settings of PreCy, in "DISPLAY", and uncheck "The CYCLE areas". Make sure "The SIGNAL line" and "The pivot lines of the SIGNAL" are checked.
The PIVOTS help make sense of the apparent chaos of the SIGNAL. They can reveal the overall direction of the choppy moves.
Especially when the 2 PIVOTS lines are parallel and oriented.
----------------------------------------------------------------------------------------------------
THIRD WAY TO READ PreCy : The CYCLE
Go in the settings of PreCy, in "DISPLAY", and uncheck "The SIGNAL line" and "The pivot lines of the SIGNAL". Make sure "The CYCLE areas" is checked.
The CYCLE is a Moving Average of the SIGNAL in relation to each candle's size.
Formula: 6 periods Moving Average of the SIGNAL * (body of the current candle / 200 periods Moving Average of the candle's bodies)
The result goes from 200 to -200.
The CYCLE shows longer term indications of the pressures of the market.
Analysing the trajectory of the CYCLE can help predict the direction of the price.
When the CYCLE goes above or below the gray low intensity zone, it signals some interest in the move.
When the CYCLE stays above 100 or below -100, it is a sign of strength in the move.
When it stayed out of the gray low intensity zone, then returns inside it, it is a strong signal of a probable change of behavior.
----------------------------------------------------------------------------------------------------
ALERTS
In the settings, you can pick the alerts you're interested in.
To activate them, right click on the chart (or alt+a), choose "Add alert on Buying/Selling Pressure Cycle (PreCy)" then "Any alert()", then "Create".
Feel free to activate them on different timeframes. The alerts show which timeframe they are from (ex: "TF:15" for the 15 minutes TF).
I have added a lot more conditions to my PreCy, taken from FREMA Trend, for ex. You can do the same with your favorite scripts, to make PreCy more accurate for your style.
----------------------------------------------------------------------------------------------------
Borrowed scripts:
To estimate the buying and selling pressures, PreCy uses the wicks calculations of "Volume net histogram" by RafaelZioni
To filter the alerts, PreCy uses the calculations of "Amplitude" by Koholintian:
----------------------------------------------------------------------------------------------------
DO NOT BASE YOUR TRADING DECISIONS ON 1 SINGLE INDICATOR'S SIGNALS.
Always confirm your ideas by other means, like price action and indicators of a different nature.

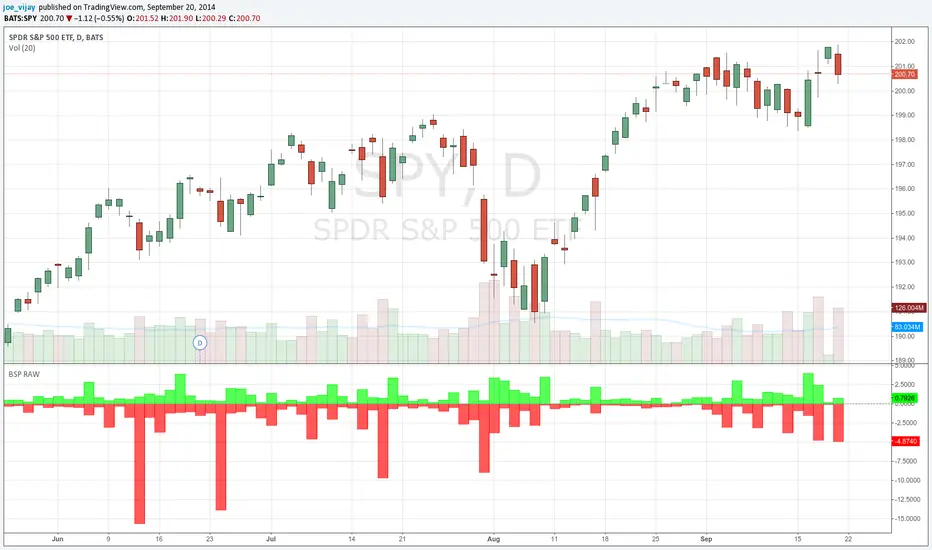
Buy/Sell Pressure Raw// This is a port of the bar by bar Buy/Sell pressure indicator by Karthik Marar.
// See below link for further details.
// karthikmarar.blogspot.com
// The only difference being I used the Hull moving average instead of WMA which the HullMA is a derivative of.
// Credits to Chris Moody for the HullMA code.
// All disclaimers apply
Buy Sell SignalBuy Sell Signal - EMA Crossover with Dynamic Risk Management
OVERVIEW
This indicator combines a dual EMA crossover system with ATR-based dynamic stop loss and take profit levels to provide complete trade management signals. Unlike basic EMA crossover scripts, this tool automatically calculates and displays entry points, stop losses, and take profit targets based on market volatility, offering traders a complete trading framework in a single indicator.
HOW IT WORKS
The indicator uses three core components working together:
Trend Detection: A fast EMA (default 5) and slow EMA (default 13) identify trend direction. When the fast EMA crosses above the slow EMA, it signals bullish momentum; when it crosses below, it signals bearish momentum.
Entry Validation: Optional candle confirmation filter ensures the crossover is accompanied by a bullish/bearish candle close, reducing false signals in choppy markets.
Risk Management: Uses ATR (Average True Range, default 14 periods) to calculate:
Stop Loss: Positioned below/above recent swing low/high minus ATR multiplier (default 0.5x)
Take Profit: Calculated using customizable risk-reward ratio (default 3:1)
KEY FEATURES
✅ Automatic Position Tracking: Monitors active trades and displays current position status (LONG/SHORT/No position)
✅ Visual Trade Management: Shows entry price (white dashed line), stop loss (red line), and take profit (green line) in real-time
✅ Trade Outcome Signals: Displays clear markers when TP is hit (🎯), SL is triggered (❌), or position is invalidated by opposite signal
✅ Information Dashboard: Live table showing entry price, SL, TP, and actual R:R ratio
✅ Smart Position Invalidation: Automatically closes and invalidates previous positions when opposite trend signal appears
✅ Customizable Alerts: Five alert conditions for BUY/SELL signals, TP hits, SL triggers, and invalidations
INPUTS
Fast EMA Length (default 5): Responsive to recent price action
Slow EMA Length (default 13): Defines broader trend direction
ATR Period (default 14): Volatility measurement period
SL Multiplier (default 0.5): Distance from swing point to stop loss
Risk:Reward Ratio (default 3.0): Target profit relative to risk
Candle Confirmation (default ON): Requires bullish/bearish candle on crossover
HOW TO USE
Apply the indicator to your chart (works on all timeframes)
Adjust EMA periods based on your trading style (shorter for scalping, longer for swing trading)
Set your preferred risk-reward ratio
Enable alerts for automated notifications
When a BUY/SELL signal appears, the indicator automatically calculates and displays your complete trade plan
Monitor the information table for live position updates
Exit when TP is reached or SL is triggered
TRADING METHODOLOGY
This script implements a momentum-following strategy based on exponential moving average crossovers, enhanced with volatility-adjusted risk parameters. The ATR-based stop loss adapts to market conditions—wider stops in volatile markets, tighter stops in calm markets. The position invalidation feature prevents traders from holding outdated positions when market sentiment shifts.
BEST PRACTICES
Use on trending markets for best results
Higher timeframes (4H, Daily) produce fewer but more reliable signals.
For scalpe use 5 and 15 minutes(Risk).
Consider market context and fundamental factors alongside signals
Adjust ATR multiplier based on asset volatility
Test different EMA combinations for your preferred instruments
ORIGINALITY
While EMA crossover systems are common, this script's value lies in its complete integration of entry logic, dynamic risk management, position tracking, and automated invalidation—features typically requiring multiple separate indicators. The ATR-based stop loss calculation and automatic R:R visualization provide practical trade execution guidance that basic crossover indicators lack.
Important Notes:
This indicator does not guarantee profitable trades
Always practice proper risk management
Backtest settings on historical data before live trading
Past performance does not indicate future results

Swing Trade BUY/SELL + SCORING +COLOUR FIXBUY/SELL labels now appear with a score (1–3) next to them.
Color coding visually distinguishes signal strength:
BUY → 1 yellow, 2 light green, 3 dark green
SELL → 1 orange, 2 red, 3 burgundy
This allows you to instantly see the signal strength both numerically and visually.

Buy Sell Volume Dashboard (Conditional Colors)Display all data in the box (dashboard) on the top right chart.
✅ Data output:
Buy Volume
Sell Volume
Volume Difference (Buy – Sell)
Buy % / Sell % Dominance
✅ Auto according to the timeframe we open (for example if open 5m, data follows 5m; if daily, follow daily).

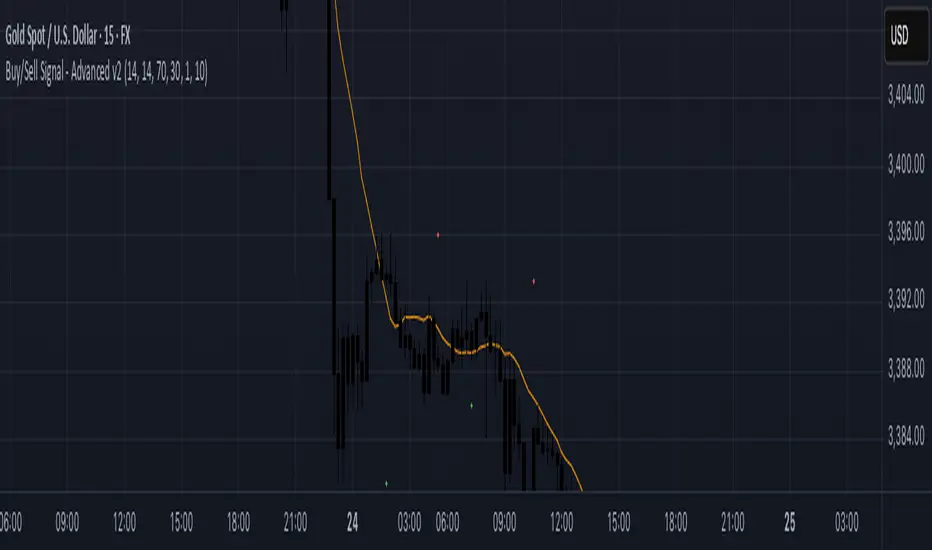
Buy/Sell Signal - Advanced v2The Buy/Sell Signal – Advanced v2 indicator is a powerful tool designed for traders who seek more reliable and filtered entries. This indicator combines classic technical analysis with modern enhancements to reduce noise and false signals. It generates Buy signals when a bullish candle closes above the 14-period Simple Moving Average (SMA), the RSI is below the oversold threshold (default: 30), and trading volume is higher than the 20-period average—indicating strong momentum and potential reversal from a discounted price zone. Conversely, a Sell signal appears when a bearish candle closes below the SMA, RSI is above the overbought level (default: 70), and volume exceeds its average—signaling potential weakness after a price rally.
In addition to entry signals, the indicator automatically plots dynamic support and resistance levels using pivot highs and lows. These levels help traders identify key zones for confirmation, breakout, or rejection. The SMA provides trend direction context, while the volume and RSI filters act as safeguards to avoid trading in low-quality conditions.
Ideal for scalpers and intraday traders on 5-minute to 1-hour timeframes, this indicator helps capture trend continuations and early reversals with confidence. For best results, use the signals in conjunction with multi-timeframe analysis and price action confirmation. This tool is especially effective on assets like XAUUSD, forex pairs, and indices.